When people talk about SCHD, its popularity often comes from a mix of historic DIVIDEND growth and steady PRICE appreciation. Over its 12-year existence, the dividend yield chart shows consistent results for the last 10 years, with an average return of over 10% per year.
Looking back from January 1, 2014 to January 1, 2024, the growth reached 190.1%, and with dividends reinvested through DRIP, an invested $10,000 would have a value of about $29,009 today. Personally, I’ve found that seeing numbers like these makes the idea of long-term investing in dividend stocks much more practical and motivating.
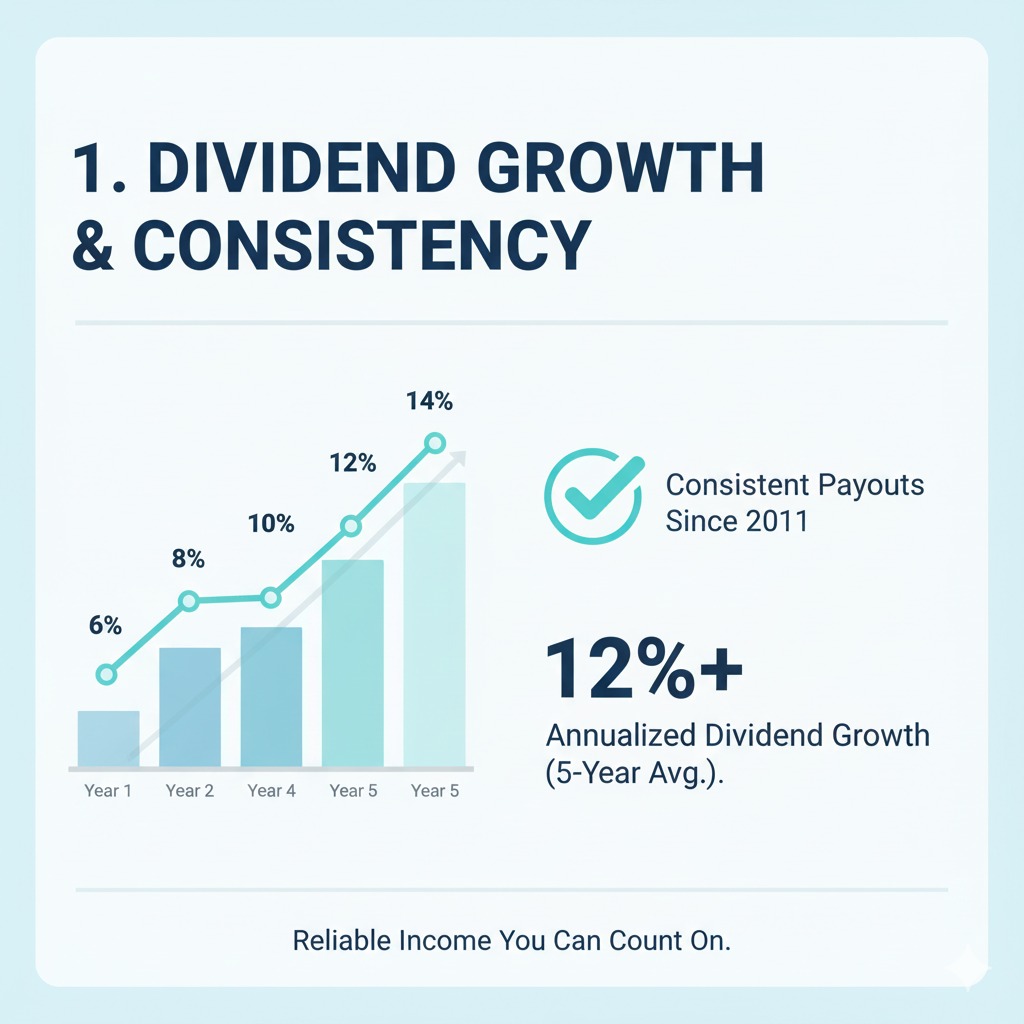
• Top chart → Share price growth vs. dividend growth from 2011 to 2024.
• Bottom chart → Portfolio growth of a $10,000 investment (2014–2024), comparing with DRIP vs. without DRIP.
Without DRIP, those same shares and dividends received would be worth around $25,900, still a respectable 159%, though the extra 31% total return shows the real power of reinvesting dividends. From its inception at $25 in 2011, the share price managed to grow to nearly $76 by Jan 2024, marking a 204% increase in 12 years.
That also translates into a Yield on Cost today of about 10.6% using $2.65 TTM dividends against the original $25 share price. While historic performance doesn’t fully guarantee future return, many investors like me see SCHD as strong enough to deliver equal or greater S&P 500 returns over time.